Just now, from ACCP:
Medical Evidence Blog
This is discussion forum for physicians, researchers, and other healthcare professionals interested in the epistemology of medical knowledge, the limitations of the evidence, how clinical trials evidence is generated, disseminated, and incorporated into clinical practice, how the evidence should optimally be incorporated into practice, and what the value of the evidence is to science, individual patients, and society.
Wednesday, August 20, 2025
Noninferiority data move navigational bronchoscopy into frontline lung biopsy discussion?
Just now, from ACCP:
Thursday, February 20, 2025
"Prophylactic" NIPPV for Extubation in Obese Patients? The De Jong study, Lancet Resp Med, 2023
I got interested in this topic after seeing a pulmccm.org post on 4 studies of the matter this morning. "They" are trying to convince me that I should be applying NIPPV to obese patients to prevent....well, to prevent what?
We begin with the French study by De Jong et al, Lancet Resp Med, 2023. The primary outcome was a composite of: 1. reintubation; 2. switch to the other therapy (HFNC); 3. "premature discontinuation of study treatment", basically meaning you dropped out of the trial, refusing to continue to participate.
Which three of those outcomes mean anything? Only reintubation. I actually went into the weeds of the trial because I wanted to know what were the criteria for reintubation. If you have some harebrained protocol for reintubation that is triggered by blood gas values or even physiological variables (respiratory rate), it could be that NIPPV just protects you from hitting one of the triggers for reintubation. You didn't "need" to be reintubated, your PaCO2 which changed almost imperceptibly (3mmHg) triggered a reintubation. These triggers for intubation are witless - they don't consider the pre-test probability of recrudescent respiratory failure, and this kind of mindless approach to intubation gets countless hapless patients unnecessarily intubated every day. Alas, the authors don't even report how the decision to reintubate was made in these patients.
But it doesn't matter. Prophylactic NIPPV doesn't prevent reintubation:
As you can see in this table, the entire difference in the composite outcome is driven by more people being "switched to the other study treatment". Why were they "switched?" We're left to guess. And being a non-blinded study, there is a severe risk that treating physicians knew the study hypothesis, believed in NIPPV, and were on a hair trigger to do "the switch".
But it doesn't matter. This table shows you that you can start off on HFNC, if you look at the doctors cross-eyed and tachypneic, they can switch you from HFNC to NIPPV and voile! You needn't worry about being reintubated at a higher rate than had you received NIPPV from the first.
Look also at the reintubation rates: ~10%. They're not extubating people fast enough! Threshold is too high.
So we have yet another study where doing something to everyone now saves them from the situation where a fraction of them would have had it done to them later. Like the 2002 Konstantinidis study of early TPA for what we now call intermediate risk PE. In that study, you can give 100 people TPA up front, or just give it to the 3% that crumps - no difference in mortality.
I won't do it. Because people are relieved to be extubated and it's a buzz kill to immediately strap a tight-fitting mask to them.
Regarding the Thille studies (this one and this one): I'm already familiar with the original study of NIPPV plus HFNC vs HFNC alone directly after extubation in patients at "high risk" of reintubation. The results were statistically significant in favor of NPPV with 18% reintubated vs 12%. And, they did a pretty good job of defining the reasons for reintubation - as well as anybody could. But these patients were all over 65 and had heart and/or lung diseases of the variety that are already primary indications for NIPPV. And the post-hoc subgroup analysis (second study linked above, a reanalysis of the first) focusing on obese patients shows the same effect as the entire cohort in the original study, with perhaps a bigger effect in overweight and obese patients. But recall, these patients have known indications for NIPPV, and we've known for 20 years that if you extubate everybody "high risk" to NIPPV, you have fewer reintubations. (The De Jong study, to their credit, excluded people with other indications for NIPPV in that study, e.g., OHS.) The question is whether you want an ICU full of people on NIPPV for 48 hours (or more) post-extubation with routine adoption of this method, or whether you wanna use it selectively.
Now would be a good time to mention the caveat I've obeyed for over 20 years. That's the Esteban 2004 NEJM study showing if you're trying to use NIPPV as "rescue therapy" for somebody already in post-extubation respiratory failure, they are more likely to die, probably because of delay of necessary reintubation and higher complication rates stemming therefrom.
Now, whenever I can get access to the Hernandez 2025 AJRCCM study, which is firewalled by ATS for this university professor (who is no longer an ATS member, having rejected the political ideology that suffused the society), I will do a new post or add to this one.
Thursday, January 23, 2025
Ignore Any Report of a Diagnostic Test that Highlights +/- Predictive Value rather than Sensitivity & Specificity
I was reading about diagnostic tests for sepsis on www.pulmccm.org just now. Excellent site to keep yourself up-to-date on all matters Pulmonary and Critical Care, by the way. It's discussing the Septicyte Rapid and the Intellisep proprietary tests. See link above for the article. These tests are technology looking for an indication and cash flow, as unfortunately so many are. Let me tell you a little secret about the studies cited that are purported to support the diagnostic utility of these tests.
Ignore Any Report of +/- Predictive Value of a Diagnostic Test.
If you know that, and to look instead for the sensitivity and specificity of the test, you can just memorize my rule and move on to your next task of self-edification today. But if you want to understand why, read on.
The predictive value (+ or -) of a test depends on sensitivity and specificity of the test and the "prevalence" of the disease under consideration in the tested population. If you're trying to understand a test, you don't care about the prevalence of disease in that population, because it may not reflect the prevalence in your population of interest. Sensitivity and Specificity are the measures of the test itself, in isolation. So whenever you see positive and negative predictive value reported, you can bet your arse that it's because the either low or high prevalence of disease in the test population made the PPV (positive predictive value) and NPV (negative predictive value) look better than the sensitivity and specificity.
Thursday, December 26, 2024
No, CXR for Pediatric Pneumonia Does NOT have a 98% Negative Predictive Value
I was reading the current issue of the NEJM today and got to the article called Chest Radiography for Presumed Pneumonia in Children - it caught my attention as a medical decision making article. It's of the NEJM genre that poses a clinical quandary, and then asks two discussants each to defend a different management course. (Another memorable one was on whether to treat subsegmental PE.) A couple of things struck me about the discussants' remarks about CXRs for kids with possible pneumonia. The first discussant says that "a normal chest radiograph reliably rules out a diagnosis of pneumonia." That is certainly not true in adults where the CXR has on the order of 50-70% sensitivity for opacities or pneumonia. So I wondered if kids are different from adults. The second discussant then remarked that CXR has a 98% negative predictive value for pneumonia in kids. This number really should get your attention. Either the test is very very sensitive and specific, or the prior probability in the test sample was very low, something commonly done to inflate the reported number. (Or, worse, the number is wrong.) I teach trainees to always ignore PPV and NPV in reports and seek out the sensitivity and specificity, as they cannot be fudged by selecting a high or low prevalence population. It then struck me that this question of whether or not to get a CXR for PNA in kids is a classic problem in medical decision making that traces its origins to Ledley and Lusted (Science, 1959) and Pauker and Kassirer's Threshold Approach to Medical Decision Making. Surprisingly, neither discussant made mention of or reference to that perfectly applicable framework (but they did self-cite their own work). Here is the Threshold Approach applied to the decision to get a CT scan for PE (Klein, 2004) that is perfectly analogous to the pediatric CXR question. I was going to write a letter to the editor pointing out that 44 years ago the NEJM published a landmark article establishing a rational framework for analyzing just this kind of question, but I decided to dig deeper and take a look at this 2018 paper in Pediatrics that both discussants referenced as the source for the NPV of 98% statistic.
In order to calculate the 98% NPV, we need to look a the n=683 kids in the study and see which cells they fall into in a classic epidemiological 2x2 table. The article's Figure 2 is the easiest way to get those numbers:
And here is the 2x2 table that accounts for the 5 kids that were initially called "no pneumonia" but were diagnosed with pneumonia within the next two weeks. Five from cell "d" (bottom right) must be moved to cell "c" (bottom left) because they were CXR-/PNA- kids that were moved into the CXR-/PNA+ column after the belated diagnosis:
The PPV has fallen trivially from 90% to 89%, but why are both so far away from the authors' claim of 98%? Because the authors conveniently ignored the 44 kids with an initially negative CXR that were nonetheless called PNA by the physicians in cell "c". They surely should be counted because, despite a negative CXR, they were still diagnosed with PNA, just 2 weeks earlier than the 5 that the authors concede were false negatives; there is no reason to make a distinction between these two groups of kids, as they are all clinically diagnosed pneumonia with a "falsely negative" CXR (cell "c").
Monday, October 28, 2024
Hickam's Dictum: Let's Talk About These Many Damn Diseases
This post is about our article on Hickam's dictum, just published online (open access!) today.
- An incidentaloma (about 30% of cases)
- A pre-existing, already known condition (about 25% of cases)
- A component of a unifying diagnosis (about 40% of cases)
- A symptomatic, coincident, independent disease, unrelated to the primary diagnosis, necessary to fully explain the acute presentation (about 4% of cases)
Tuesday, September 26, 2023
The Fallacy of the Fallacy of the Single Diagnosis: Post-publication Peer Review to the Max!
Prepare for the Polemic.
Months ago, I stumbled across this article in Medical Decision Making called "The Fallacy of a Single Diagnosis" by Don Redelmeier and Eldar Shafir (hereafter R&S). In it they purport to show, using vignettes given to mostly lay people, that people have an intuition that there should be a single diagnosis, which, they claim, is wrong, and they attempt to substantiate this claim using a host of references. I make the following observations and counterclaims:
- R&S did indeed show that their respondents thought that having one virus, such as influenza (or EBV, or GAS pharyngitis), decreases the probability of having COVID simultaneously
- Their respondents are not wrong - having influenza does decrease the probability of a diagnosis of COVID
- R&S's own references show that their respondents were normative in judging a reduced probability of COVID if another respiratory pathogen was known to be present
Monday, June 26, 2023
Anchored on Anchoring: A Concept Cut from Whole Cloth
Welcome back to the blog. An article published today in JAMA Internal Medicine was just the impetus I needed to return after more than a year.
Hardly a student of medicine who has trained in the past 10 years has not heard of "anchoring bias" or anchoring on a diagnosis. What is this anchoring? Customarily in cognitive psychology, to demonstrate a bias empirically, you design an experiment that shows directional bias in some response, often by introducing an irrelevant (independent) variable e.g., a reference frame, as we did here and here. Alternatively, you could show bias if responses deviate from some known truth value as we did here. What does not pass muster is to simply say "I think there is a bias whereby..." and write an essay about it.
That is what happened 20 years ago when an expository essay by Crosskerry proposed "anchoring" as a bias in medical decision making, which he ostensibly named after the "anchoring and adjustment" heuristic demonstrated by Kahneman and Tversky (K&T) in experiments published in their landmark 1974 Science paper. The contrast between "anchoring to a diagnosis" (A2D) and K&T's anchoring and adjustment (A&A) makes it clear why I bridle so much at the former.
To wit: First, K&T showed A&A via an experiment with an independent (and irrelevant) variable. They had participants in this experiment spin a dial on a wheel with associated numbers, like on the Wheel of Fortune game show. (They did not know that the dial was rigged to land on either 10 or 65.) They were then asked whether the number of African countries that are members of the United Nations was more or less than that number; and then to give their estimate of the number of member countries. The numerical anchors, 10 and 65, biased responses. For the group of participants whose dials landed on 10, their estimates were lower, and for the other group (65), they were higher.
Sunday, May 22, 2022
Common Things Are Common, But What is Common? Operationalizing The Axiom
"Prevalence [sic: incidence] is to the diagnostic process as gravity is to the solar system: it has the power of a physical law." - Clifton K Meador, A Little Book of Doctors' Rules
We recently published a paper with the same title as this blog post here. The intent was to operationalize the age-old "common things are common" axiom so that it is practicable to employ it during the differential diagnosis process to incorporate probability information into DDx. This is possible now in a way that it never has been before because there are now troves of epidemiological data that can be used to bring quantitative (e.g., 25 cases/100,000 person-years) rather than mere qualitative (e.g., very common, uncommon, rare, etc) information to bear on the differential diagnosis. I will briefly summarize the main points of the paper and demonstrate how it can be applied to real-world diagnostic decision making.
First is that the proper metric for "commonness" is disease incidence (standardized as cases/100,000 person-years) not disease prevalence. Incidence is the number of new cases per year - those that have not been previously diagnosed - whereas prevalence is the number of already diagnosed cases. It the disease is already present, there is no diagnosis to be made (see article for more discussion of this). Prevalence is approximately equal the product of incidence & disease duration, so it will be higher (oftentimes a lot higher) than incidence for diseases with a chronic component; this will lead to overestimation of the likelihood of diagnosing a new case. Furthermore, your intuitions about disease commonness are mostly based on how frequently you see patients with the disease (e.g., SLE) but most of these are prevalent not incident cases so you will think SLE is more common than it really is, diagnostically. If any of this seems counterintuitive, see our paper for details (email me for pdf copy if you can't access it).
Second is that commonness exists on a continuum spanning 5 or more orders of magnitude, so it is unwise to dichotomize diseases as common or rare as information is lost in doing so. If you need a rule of thumb though, it is this: if the disease you are considering has single-digit (or less) incidence in 100,000 p-y, that disease is unlikely to be the diagnosis out of the gate (before ruling out more common diseases). Consider that you have approximately a 15% chance of ever personally diagnosing a pheochromocytoma (incidence <1/100,000 P-Y) during an entire 40 year career as there are only 2000 cases diagnosed per year in the USA, and nearly one million physicians in a position to initially diagnose them. (Note also that if you're rounding with a team of 10 physicians, and a pheo gets diagnosed, you can't each count this is an incident diagnosis of pheo. If it's a team effort, you each diagnosed 1/10th of a pheochromocytoma. This is why "personally diagnosing" is emphasized above.) A variant of the common things axiom states "uncommon presentations of common diseases are more common than common presentations of uncommon diseases" - for more on that, see this excellent paper about the range of presentations of common diseases.
Third is that you cannot take a raw incidence figure and use it as a pre-test probability of disease. The incidence in the general population does not represent the incidence of diseases presenting to the clinic or the emergency department. What you can do however, is take what you do know about patients presenting with a clinical scenario, and about general population incidence, and make an inference about relative likelihoods of disease. For example, suppose a 60-year-old man presents with fever, hemoptysis and a pulmonary opacity that may be a cavity on CXR. (I'm intentionally simplifying the case so that the fastidious among you don't get bogged down in the details.) The most common cause of this presentation hands down is pneumonia. But, it could also represent GPA (formerly Wegener's, every pulmonologist's favorite diagnosis for hemoptysis) or TB (tuberculosis, every medical student's favorite diagnosis for hemoptysis). How could we use incidence data to compare the relative probabilities of these 3 diagnostic possibilities?
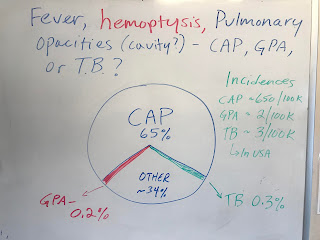
Suppose we were willing to posit that 2/3rds of the time we admit a patient with fever and opacities, it's pneumonia. Using that as a starting point, we could then do some back-of-the-envelope calculations. CAP has an incidence on the order of 650/100k P-Y; GPA and TB have incidences on the order of 2 to 3/100k PY respectively - CAP is 200-300x more common than these two zebras. (Refer to our paper for history and references about the "zebra" metaphor.) If CAP occupies 65% of the diagnostic probability space (see image and this paper for an explication), then it stands to reason that, ceteris paribus (and things are not always ceteris paribus), the TB and GPA occupy on the order of 1/200th of 65%, or about 0.25% of the probability space. From an alternative perspective, a provider will admit 200 cases of pneumonia for every case of TB or GPA she admits - there's just more CAP out there to diagnose! Ask yourself if this passes muster - when you are admitting to the hospital for a day, how many cases of pneumonia do you admit, and when is the last time you yourself admitted and diagnosed a new case of GPA or TB? Pneumonia is more than two orders of magnitude more common than GPA and TB and, barring a selection or referral bias, there just aren't many of the latter to diagnose! If you live in a referral area of one million people, there will only be 20-30 cases of GPA diagnosed in that locale during in a year (spread amongst hospitals/clinics), whereas there will be thousands of cases of pneumonia.
As a parting shot, these are back-of-the-envelope calculations, and their several limitations are described in our paper. Nonetheless, they are grounding for understanding the inertial pull of disease frequency in diagnosis. Thus, the other day I arrived in the AM to hear that a patient was admitted with supposed TTP (thrombotic thrombocytopenic purpura) overnight. With an incidence of about 0.3 per 100,000 PY, that is an extraordinary claim - a needle in the haystack has been found! - so, without knowing anything else, I wagered that the final diagnosis would not be TTP. (Without knowing anything else about the case, I was understandably squeamish about giving long odds against it, so I wagered at even odds, a $10 stake.) Alas, the final diagnosis was vitamin B12 deficiency (with an incidence on the order of triple digits per 100k PY), with an unusual (but well recognized) presentation that mimics TTP & MAHA.
Incidence does indeed have the power of a physical law; and as Hutchison said in an address in 1928, the second commandment of diagnosis (after "don't be too clever") is "Do not diagnose rarities." Unless of course the evidence demands it - more on that later.
Saturday, October 30, 2021
CANARD: Coronavirus Associated Nonpathogenic Aspergillus Respiratory Disease
![]() |
Cavitary MSSA disease in COVID |
One of the many challenges of pulmonary medicine is unexplained dyspnea which, after an extensive investigation, has no obvious cause excepting "overweight and out of shape" (OWOOS). It can occur in thin and fit people too, and can also have a psychological origin: psychogenic polydyspnea, if you will. This phenomenon has been observed for quite some time. Now, overlay a pandemic and the possibility of "long COVID". Inevitably, people who would have been considered to have unexplained dyspnea in previous eras will come to attention after being infected with (or thinking they may have been infected with) COVID. Without making any comment on long COVID, it is clear that some proportion of otherwise unexplained dyspnea that would have come to attention had there been no pandemic will now come after COVID and thus be blamed on it. (Post hoc non ergo propter hoc.) When something is widespread (e.g., COVID), we should be careful about drawing connections between it and other highly prevalent (and pre-existing) phenomena (e.g., unexplained dyspnea).
We worry that if the immanent methodological limitations of this and similar studies are not adequately acknowledged—they are not listed among the possible explanations for the results enumerated by the editorialist (2)—an avalanche of testing for aspergillosis in ICUs may ensue, resulting in an epidemic of overdiagnosis and overtreatment. We caution readers of this report that it cannot establish the true prevalence of Aspergillus infection in patients with ventilator-associated pneumonia in the ICU, but it does underscore the fact that when tests with imperfect specificity are applied in low-prevalence cohorts, most positive results are false positives (10).
In the discovery cohort of the study linked above, Figure 1 shows that only 6 patients of 279 (2%) had "proven" disease, 4 with "tracheobronchitis" (it is not mentioned how this unusual manifestation of IPA was diagnosed; presumably via biopsy; if not, it should have counted as "probable" disease; see these guidelines), and 2 others meeting the proven definition. The remaining 36 patients had probable CAPA (32) and possible CAPA (4). In the validation cohort, there were 21 of 209 patients with alleged CAPA, all of them in the probable category (2 with probable tracheobronchitis, 19 with probable CAPA). Thus the prevalence (sic: incidence) of IPA in patients with COVID is a hodgepodge of a bunch of different diseases across a wide spectrum of diagnostic certainty.
Future studies should - indeed, must - exclude patients on chronic immunosuppression and those with immunodeficiency from these cohorts and also describe the specific details that form the basis of the diagnosis and diagnostic certainty category. Meanwhile, clinicians should recognize that the purported 15% incidence rate of CAPA/IPA in COVID comprises mostly immunosuppressed patients and patients with probable or possible - not proven - disease. Some proportion of alleged CAPA is actually a CANARD.
Wednesday, April 14, 2021
Bias in Assessing Cognitive Bias in Forensic Pathology: The Dror Nevada Death Certificate "Study"
Following the longest hiatus in the history of the Medical Evidence Blog, I return to issues of forensic medicine, by happenstance alone. In today's issue of the NYT is this article about bias in forensic medicine, spurred by interest in the trial of the murder of George Floyd. Among other things, the article discusses a recently published paper in the Journal of Forensic Sciences for which there were calls for retraction by some forensic pathologists. According to the NYT article, the paper showed that forensic pathologists have racial bias, a claim predicated upon an analysis of death certificates in Nevada, and a survey study of forensic pathologists, using a methodology similar to that I have used in studying physician decisions and bias (viz, randomizing recipients to receiving one of two forms of a case vignette that differ in the independent variable of interest). The remainder of this post will focus on that study, which is sorely in need of some post-publication peer review.
The study was led by Itiel Dror, PhD, a Harvard trained psychologist now at University College London who studies bias, with a frequent focus on forensic medicine, if my cursory search is any guide. The other authors are a forensic pathologist (FP) at University of Alabama Birmingham (UAB), a FP and coroner in San Luis Obispo, California, a lawyer with the Clark County public defender's office in Las Vegas, Nevada, a PhD psychologist from Towson University in Towson, Maryland, an FP proprietor of a Forensics company who is a part time medical examiner for West Virginia, and an FP who is proprietor of a forensics and legal consulting company in San Francisco, California. The purpose of identifying the authors was to try to understand why the analysis of death certificates was restricted to the state of Nevada. Other than one author's residence there, I cannot understand why Nevada was chosen, and the selection is not justified in the paltry methods section of the paper.
Sunday, February 16, 2020
Misunderstanding and Misuse of Basic Clinical Decision Principles among Child Abuse Pediatricians
The article and associated correspondence at issue is entitled The Positive Predictive Value of Rib Fractures as an Indicator of Nonaccidental Trauma in Children published in 2004. The authors looked at a series of rib fractures in children at a single Trauma Center in Colorado during a six year period and identified all patients with a rib fracture. They then restricted their analysis to children less than 3 years of age. There were 316 rib fractures among just 62 children in the series; the average number of rib fractures per child is ~5. The proper unit of analysis for a study looking at positive predictive value is children, sorted into those with and without abuse, and with and without rib fracture(s) as seen in the 2x2 tables below.
Tuesday, January 28, 2020
Bad Science + Zealotry = The Wisconsin Witch Hunts. The Case of John Cox, MD
![]() |
John Cox, MD |
Thursday, December 5, 2019
Noninferiority Trials of Reduced Intensity Therapies: SCORAD trial of Radiotherapy for Spinal Metastases
No mets here just my PTX |
The results of the SCORAD trial were consistent with our analysis of 30+ other noninferiority trials of reduced intensity therapies, and the point estimate favored - you guessed it - the more intensive radiotherapy. This is fine. It is also fine that the 1-sided 95% confidence interval crossed the 11% prespecified margin of noninferiority (P=0.06). That just means you can't declare noninferiority. What is not fine, in my opinion, is that the authors suggest that we look at how little overlap there was, basically an insinuation that we should consider it noninferior anyway. I crafted a succinct missive to point this out to the editors, but alas I'm too busy to submit it and don't feel like bothering, so I'll post it here for those who like to think about these issues.
To the editor: Hoskin et al report results of a noninferiority trial comparing two intensities of radiotherapy (single fraction versus multi-fraction) for spinal cord compression from metastatic cancer (the SCORAD trial)1. In the most common type of noninferiority trial, investigators endeavor to show that a novel agent is not worse than an established one by more than a prespecified margin. To maximize the chances of this, they generally choose the highest tolerable dose of the novel agent. Similarly, guidelines admonish against underdosing the active control comparator as this will increase the chances of a false declaration of noninferiority of the novel agent2,3. In the SCORAD trial, the goal was to determine if a lower dose of radiotherapy was noninferior to a higher dose. Assuming radiotherapy is efficacious and operates on a dose response curve, the true difference between the two trial arms is likely to favor the higher intensity multi-fraction regimen. Consequently, there is an increased risk of falsely declaring noninferiority of single fraction radiotherapy4. Therefore, we agree with the authors’ concluding statement that “the extent to which the lower bound of the CI overlapped with the noninferiority margin should be considered when interpreting the clinical importance of this finding.” The lower bound of a two-sized 95% confidence interval (the trial used a 1-sided 95% confidence interval) extends to 13.1% in favor of multi-fraction radiotherapy. Because the outcome of the trial was ambulatory status, and there were no differences in serious adverse events, our interpretation is that single fraction radiotherapy should not be considered noninferior to a multi-fraction regimen, without qualifications.1. Hoskin PJ, Hopkins K, Misra V, et al. Effect of Single-Fraction vs Multifraction Radiotherapy on Ambulatory Status Among Patients With Spinal Canal Compression From Metastatic Cancer: The SCORAD Randomized Clinical Trial. JAMA. 2019;322(21):2084-2094.2. Piaggio G, Elbourne DR, Pocock SJ, Evans SW, Altman DG, f CG. Reporting of noninferiority and equivalence randomized trials: Extension of the consort 2010 statement. JAMA. 2012;308(24):2594-2604.3. Jones B, Jarvis P, Lewis JA, Ebbutt AF. Trials to assess equivalence: the importance of rigorous methods. BMJ. 1996;313(7048):36-39.4. Aberegg SK, Hersh AM, Samore MH. Do non-inferiority trials of reduced intensity therapies show reduced effects? A descriptive analysis. BMJ open. 2018;8(3):e019494-e019494.
Saturday, November 23, 2019
Pathologizing Lipid Laden Macrophages (LLMs) in Vaping Associated Lung Injury (VALI)
"Although the pathophysiological significance of these lipid-laden macrophages and their relation to the cause of this syndrome are not yet known, we posit that they may be a useful marker of this disease.3-5 Further work is needed to characterize the sensitivity and specificity of lipid-laden macrophages for vaping-related lung injury, and at this stage they cannot be used to confirm or exclude this syndrome. However, when vaping-related lung injury is suspected and infectious causes have been excluded, the presence of lipid-laden macrophages in BAL fluid may suggest vaping-related lung injury as a provisional diagnosis."There, we outlined the two questions about their significance: 1.) any relation to the pathogenesis of the syndrome; and 2.) whether, after characterizing their sensitivity and specificity, they can be used in diagnosis. I am not a lung biologist, so I will ignore the first question and focus on the second, where I actually do know a thing or two.
We still do not know the sensitivity or specificity of LLMs for VALI, but we can make some wagers based on what we do know. First, regarding sensitivity. In our ongoing registry at the University of Utah, we have over 30 patients with "confirmed" VALI (if you dont' have a gold standard, how do you "confirm" anything?), and to date all but one patient had LLMs in excess of 20% on BAL. For the first several months we bronched everybody. So, in terms of BAL and LLMs, I'm guessing we have the most extensive and consistent experience. Our sensitivity therefore is over 95%. In the Layden et al WI/IL series in NEJM, there were 7 BAL samples and all 7 had "lipid Layden macrophages" (that was a pun). In another Utah series, Blagev et al reported that 8 of 9 samples tested showed LLMs. Combining those data (ours are not yet published, but soon will be) we can state the following: "Given the presence of VALI, the probability of LLM on Oil Red O staining (OROS) is 96%." You may recognize that as a statement of sensitivity. It is unusual to not find LLMs on OROS of BAL fluid in cases of VALI, and because of that, their absence makes the case atypical, just as does the absence of THC vaping. Some may go so far as to say their absence calls into question the diagnosis, and I am among them. But don't read between the lines. I did not say that bronchoscopy is indicated to look for them. I simply said that their absence makes the case atypical and calls it into question.
Sunday, September 1, 2019
Pediatrics and Scare Tactics: From Rock-n-Play to Car Safety Seats
![]() |
Is sleeping in a car seat dangerous? |
Last week, the AAP was at it again, playing loose with the data but tight with recommendations based upon them. This time, it's car seats. In an article in the August, 2019 edition of the journal Pediatrics, Liaw et al present data showing that, in a cohort of 11,779 infant deaths, 3% occurred in "sitting devices", and in 63% of this 3%, the sitting device was a car safety seat (CSS). In the deaths in CSSs, 51.6% occurred in the child's home rather than in a car. What was the rate of infant death per hour in the CSS? We don't know. What is the expected rate of death for the same amount of time sleeping, you know, in the recommended arrangement? We don't know! We're at it again - we have a numerator without a denominator, so no rate and no rate to compare it to. It could be that 3% of the infant deaths occurred in car seats because infants are sleeping in car seats 3% of the time!
Sunday, July 21, 2019
Move Over Feckless Extubation, Make Room For Reckless Extubation
Spoiler alert - when the patients you enroll in your weaning trial have a base rate of extubation success of 93%, you should not be doing an SBT - you should be extubating them all, and figuring out why your enrollment criteria are too stringent and how many extubatable patients your enrollment criteria are missing because of low sensitivity and high specificity.
Tuesday, May 7, 2019
Etomidate Succs: Preventing Dogma from Becoming Practice in RSI

The PreVent trial compared bagging versus no bagging after induction of anesthesia for rapid sequence intubation (RSI). Careful readers of this and another recent trial testing the dogma of videolaryngoscopy will notice several things that may significantly limit the external validity of the results.
- The median time from induction to intubation was 130 seconds in the no bag ventilation group, and 158 seconds in the bag ventilation group (NS). That's 2 to 2.5 minutes. In the Lascarrou 2017 JAMA trial of direct versus video laryngoscopy, it was three minutes. Speed matters. The time that a patient is paralyzed and non-intubated is a very dangerous time and it ought to be as short as possible
- The induction agent was Etomidate (Amidate) in 80% of the patients in the PreVent trial and 90% of patients in the Larascarrou trial (see supplementary appendix of PreVent trial)
- The intubations were performed by trainees in approximately 80% of intubations in both trials (see supplementary appendix of PreVent trial)
Thursday, April 25, 2019
The EOLIA ECMO Bayesian Reanalysis in JAMA
![]() |
A Hantavirus patient on ECMO, circa 2000 |
My letter to the editor of JAMA was published today (and yeah I know, I write too many letters, but hey, I read a lot and regular peer review often doesn't cut it) and even when you come at them like a spider monkey, the authors of the original article still get the last word (and they deserve it - they have done far more work than the post-publication peer review hecklers with their quibbles and their niggling letters.)
But to set some thing clear, I will need some more words to elucidate some points about the study's interpretation. The authors' response to my letter has five points.
- I (not they) committed confirmation bias, because I postulated harm from ECMO. First, I do not have a personal prior for harm from ECMO, I actually think it is probably beneficial in properly selected patients, as is well documented in the blog post from 2011 describing my history of experience with it in hantavirus, and as well in a book chapter I wrote in Cardiopulmonary Bypass Principles and Practice circa 2006. There is irony here - I "believe in" ECMO, I just don't think their Bayesian reanalysis supports my (or anybody's) beliefs in a rational way! The point is that it was a post hoc unregistered Bayesian analysis after a pre-registered frequentist study which was "negative" (for all that's worth and not worth), and the authors clearly believe in the efficacy of ECMO as do I. In finding shortcomings in their analysis, I seek to disconfirm or at least challenge no only their but my own beliefs. And I think that if the EOLIA trial had been positive, that we would not be publishing Bayesian reanalyses showing how the frequentist trial may be a type I error. We know from long experience that if EOLIA had been "positive" that success would have been declared for ECMO as it has been with prone positioning for ARDS. (I prone patients too.) The trend is to confirm rather than to disconfirm, but good science relies more on the latter.
- That a RR of 1.0 for ECMO is a "strongly skeptical" prior. It may seem strong from a true believer standpoint, but not from a true nonbeliever standpoint. Those are the true skeptics (I know some, but I'll not mention names - I'm not one of them) who think that ECMO is really harmful on the net, like intensive insulin therapy (IIT) probably is. Regardless of all the preceding trials, if you ask the NICE-SUGAR investigators, they are likely to maintain that IIT is harmful. Importantly, the authors skirt the issue of the emphasis they place on the only longstanding and widely regarded as positive ARDS trial (of low tidal volume). There are three decades of trials in ARDS patients, scores of them, enrolling tens of thousands of patients, that show no effect of the various therapies. Why would we give primacy to the the one trial which was positive, and equate ECMO to low tidal volume? Why not equate it to high PEEP, or corticosteroids for ARDS? A truly skeptical prior would have been centered on an aggregate point estimate and associated distribution of 30 years of all trials in ARDS of all therapies (the vast majority of them "negative"). The sheer magnitude of their numbers would narrow the width of the prior distribution with RR centered on 1.0 (the "severely skeptical" one), and it would pull the posterior more towards zero benefit, a null result. Indeed, such a narrow prior distribution may have shown that low tidal volume is an outlier and likely to be a false positive (I won't go any farther down that perilous path). The point is, even if you think a RR of 1.0 is severely skeptical, the width of the distribution counts for a lot too, and the uninitiated are likely to miss that important point.
- Priors are not used to "boost" the effect of ECMO. (My original letter called it a Bayesian boost, borrowing from Mayo, but the adjective was edited out.) Maybe not always, but that was the effect in this case, and the respondents did not cite any examples of a positive frequentist result that was reanalyzed with Bayesian methods to "dampen" the observed effect. It seems to only go one way, and that's why I alluded to confirmation bias. The "data-driven priors" they published were tilted towards a positive result, as described above.
- Evidence and beliefs. But as Russell said "The degree to which beliefs are based on evidence is very much less than believers suppose." I support Russell's quip with the aforementioned.
- Judgment is subjective, etc. I would welcome a poll, in the spirit of crowdsourcing, as we did here to better understand what the community thinks about ECMO (my guess is it's split ratherly evenly, with a trend, perhaps strong, for the efficacy of ECMO). The authors' analysis is laudable, but it is not based on information not already available to the crowd; rather it transforms it in ways may not be transparent to the crowd and may magnify it in a biased fashion if people unfamiliar with Bayesian methods do not scrutinize the chosen prior distributions.
Sunday, April 21, 2019
A Finding of Noninferiority Does Not Show Efficacy - It Shows Noninferiority (of short course rifampin for MDR-TB)
![]() |
An image of two separated curves from Mayo's book SIST |
Conversely, in a noninferiority trial, your null hypothesis is not that there is no difference between the groups as it is in a superiority trial, but rather it is that there is a difference bigger than delta (the pre-specified margin of noninferiority. Rejection of the null hypothesis a leads you to conclude that there is no difference bigger than delta, and you then conclude noninferiority. If you are comparing a new antibiotic to vancomycin, and you want to be able to conclude noninferiority, you may intentionally or subconsciously dose vancomycin at the lower end of the therapeutic range, or shorten the course of therapy. Doing this increases the chances that you will reject the null hypothesis and conclude that there is no difference greater than delta in favor of vancomycin and that your new drug is noninferior. However, this increases your type 1 error rate - the rate at which you falsely conclude noninferiority.